The problem
Predicting a pedestrian’s future path involves more than minimizing displacement error: several plausible paths may exist, and some generated candidates match human behavior better than others. This work asks how to quantify that preference and use it to train a trajectory predictor.
How the method works
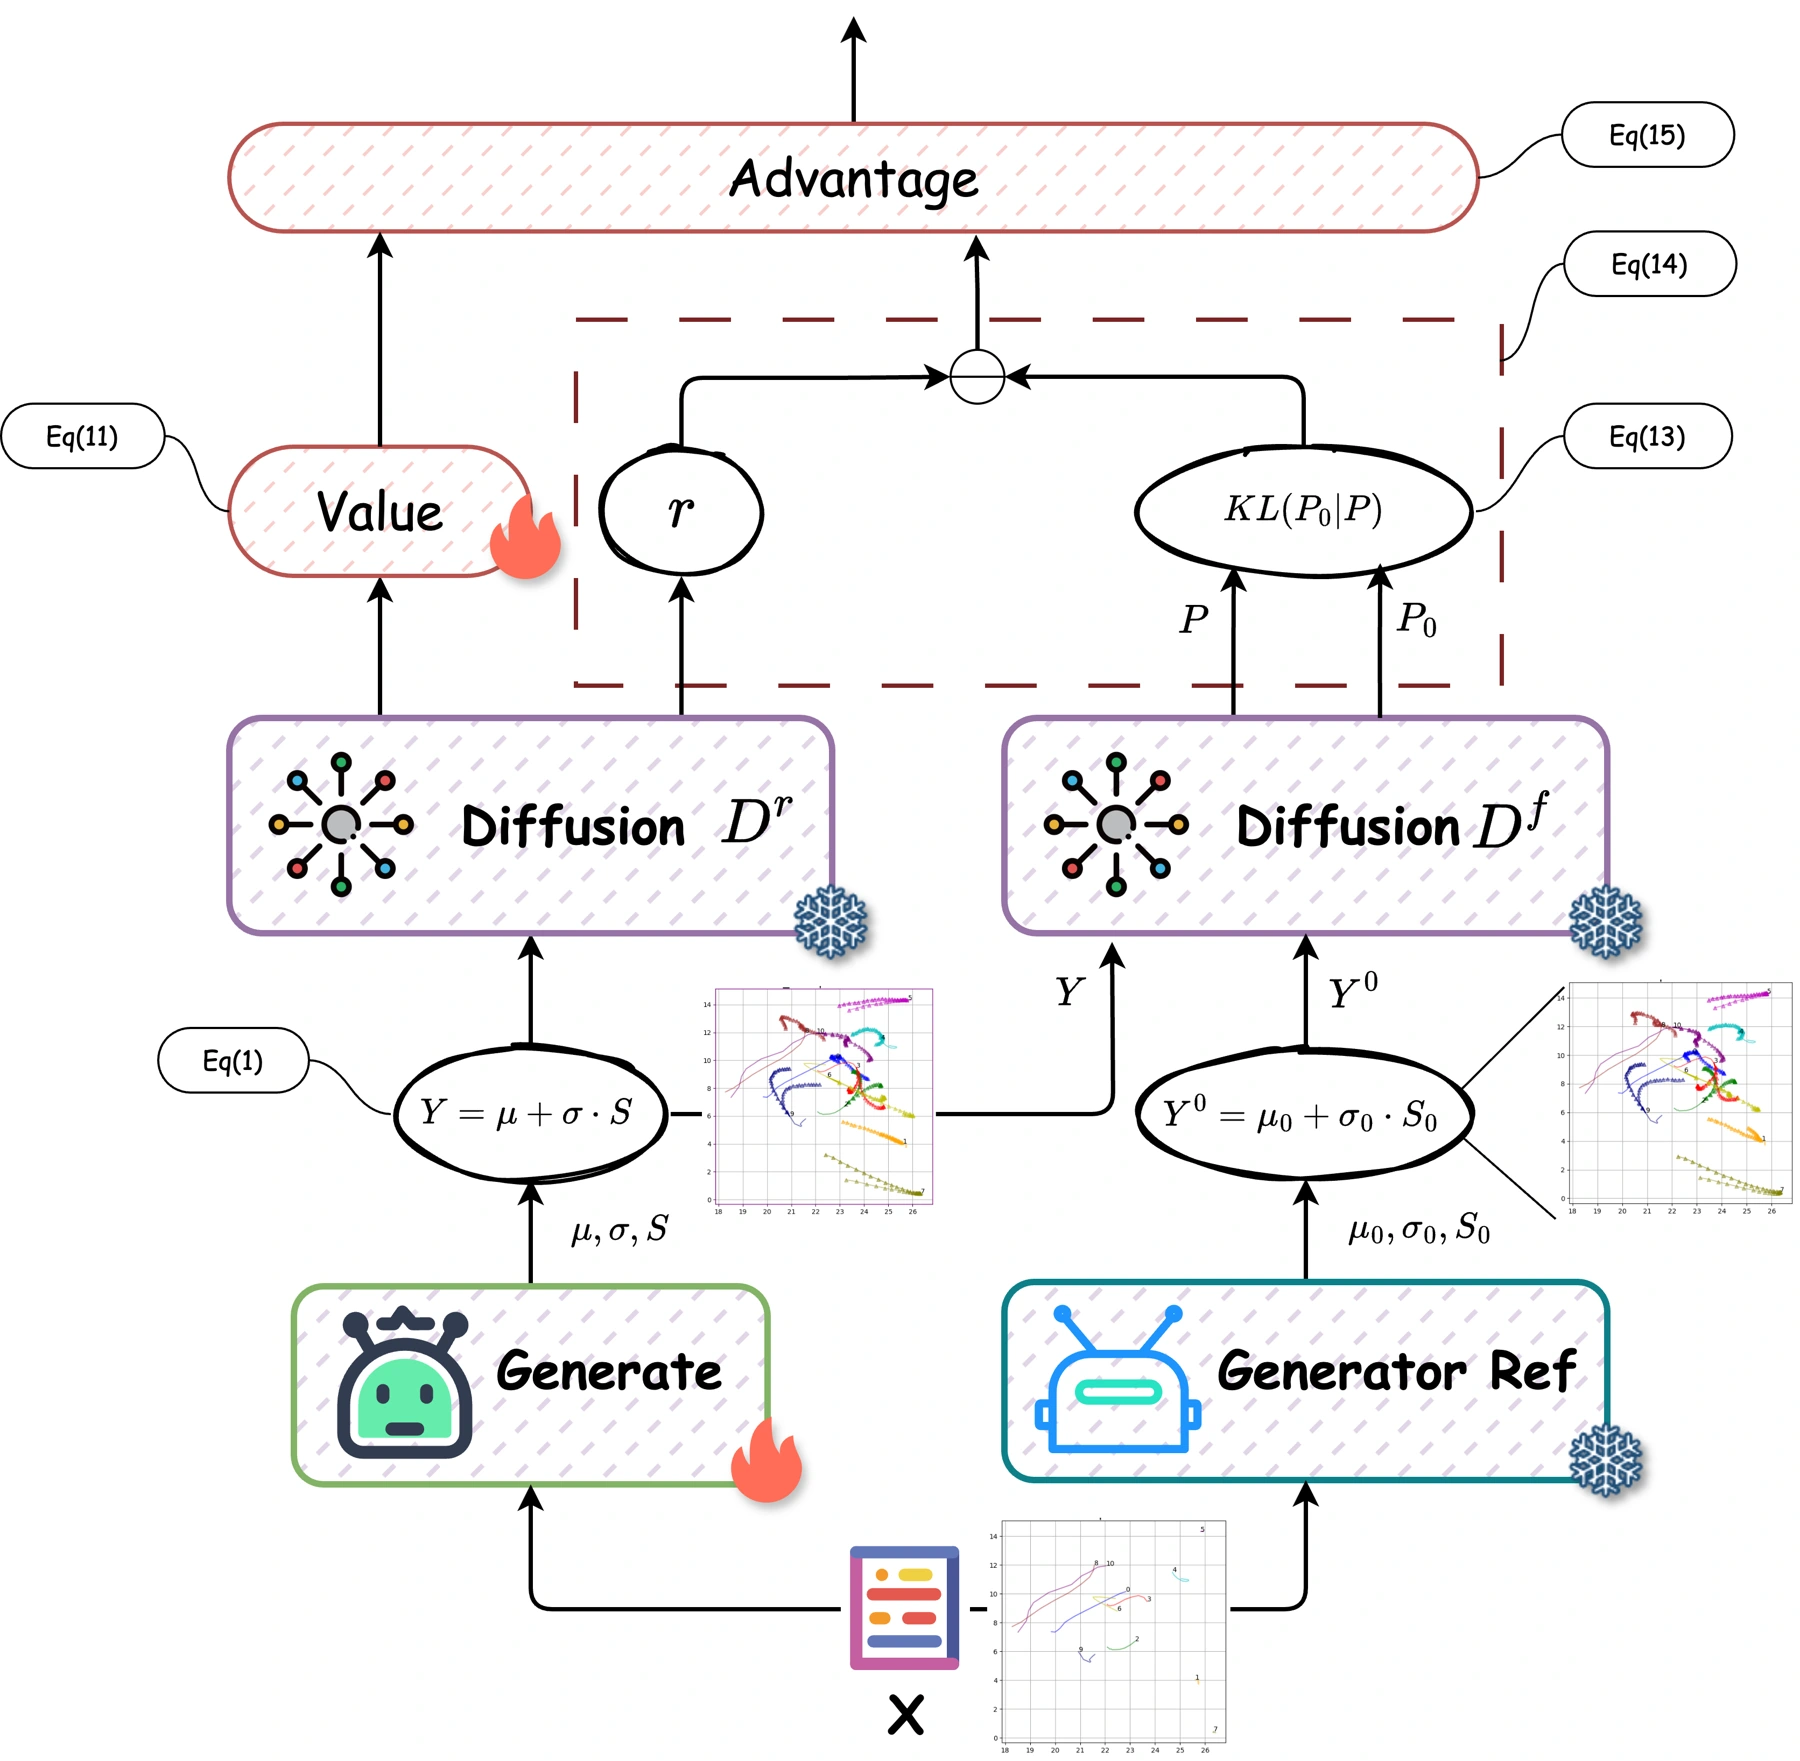
- Learn a preference score. A pretrained diffusion model captures trajectory behavior in latent space. Its normalized denoising residual scores how closely a predicted trajectory aligns with observed human behavior, providing a surrogate reward for human preferences.
- Refine the predictor with RLHF. Proximal Policy Optimization updates the trajectory generator using that reward. A frozen reference generator and a KL penalty regularize the update; a value model estimates the advantage used for optimization.
- Select useful candidates. Rejection sampling retains high-scoring trajectories for policy updates, reducing the influence of candidates that deviate strongly from realistic behavior.
Diffusion residuals as a preference signal
The method learns a trajectory-behavior prior in latent space. A predicted trajectory is encoded, perturbed through the diffusion process, and scored using its denoising residual. Normalizing that residual against the corresponding observed-trajectory residual produces a score for alignment with human behavior.
The reward is therefore a learned surrogate for preference, rather than a separate human label supplied for every policy update. The paper defines an Average Trajectory Score (ATS) over the prediction horizon and a Final Trajectory Score (FTS) for the last step. They complement displacement errors by providing a ranking signal for stochastic candidate paths.
The reinforcement-learning update
The trainable generator produces trajectories, while a frozen reference generator anchors its behavior. The reward combines the diffusion-based score with KL regularization relative to the reference. A two-layer value head estimates state value, and Proximal Policy Optimization uses the resulting advantage to update the generator.
RLHF-ReS adds rejection sampling: high-scoring candidates contribute to policy updates, reducing the influence of poor sampled paths. This connects candidate ranking to the learning objective instead of using it only after prediction.
Datasets and evaluation
The numerical comparison covers ETH, HOTEL, UNIV, ZARA1, ZARA2, NBA, and Robo, with additional SDD analysis described in the text. Predictions are sampled 20 times per example.
- minADE20: the smallest average displacement error among the 20 candidates; lower is better.
- minFDE20: the smallest final-step displacement error; lower is better.
- maxATS20 / maxFTS20: the largest trajectory-preference scores among the candidates; higher is better.
Minimum-error sampling metrics measure the quality of the candidate set; they do not mean the system knows which candidate is best at deployment. The separate ranking experiment below examines that selection problem.
Prediction accuracy and preference alignment
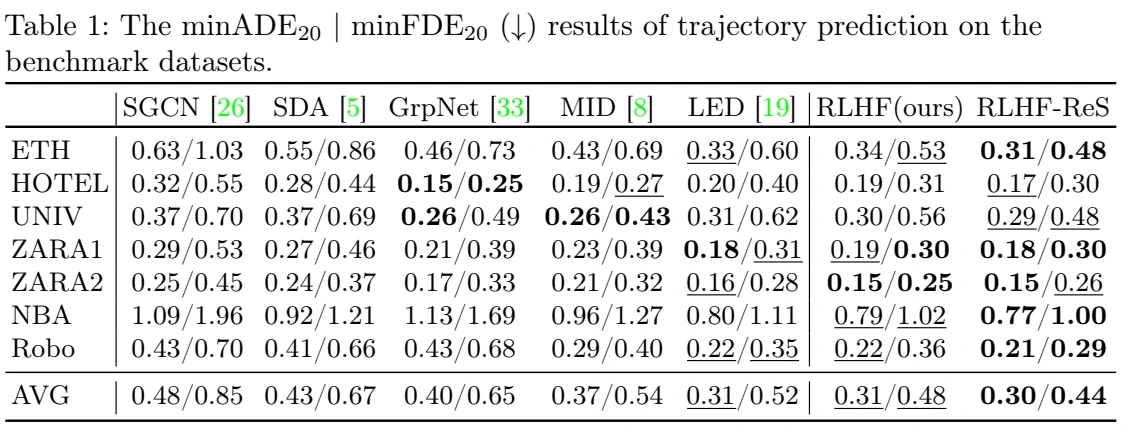
In the average row, LED reports 0.31 ADE and 0.52 FDE. RLHF gives 0.31 and 0.48, and RLHF-ReS gives 0.30 and 0.44. Relative to LED, the reported RLHF-ReS improvement is 3.2% in ADE and 15.4% in FDE. Individual datasets retain their own results; the full configuration is not best in every cell.
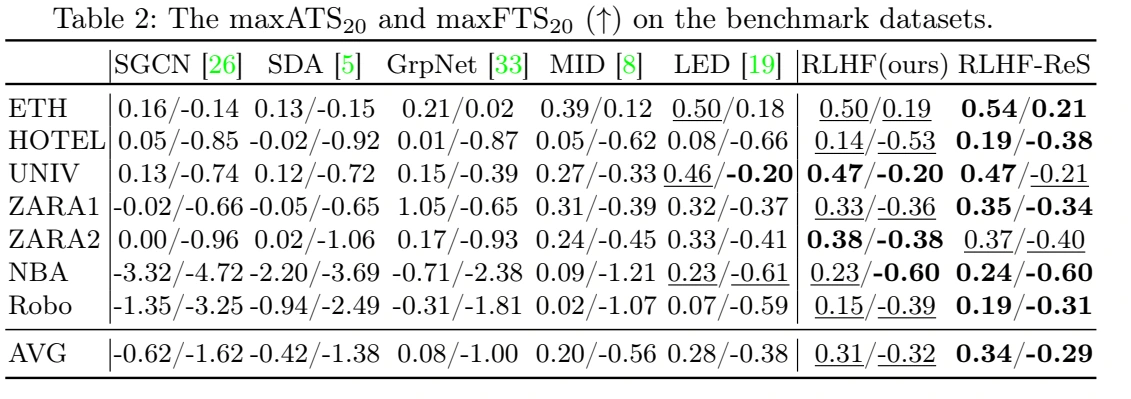
Average ATS / FTS changes from 0.28 / −0.38 for LED to 0.34 / −0.29 for RLHF-ReS. Higher scores indicate greater alignment under the proposed metric. FTS can be negative because its normalization compares the final-step residual to the observed-trajectory reference.
Trajectory examples and human evaluation
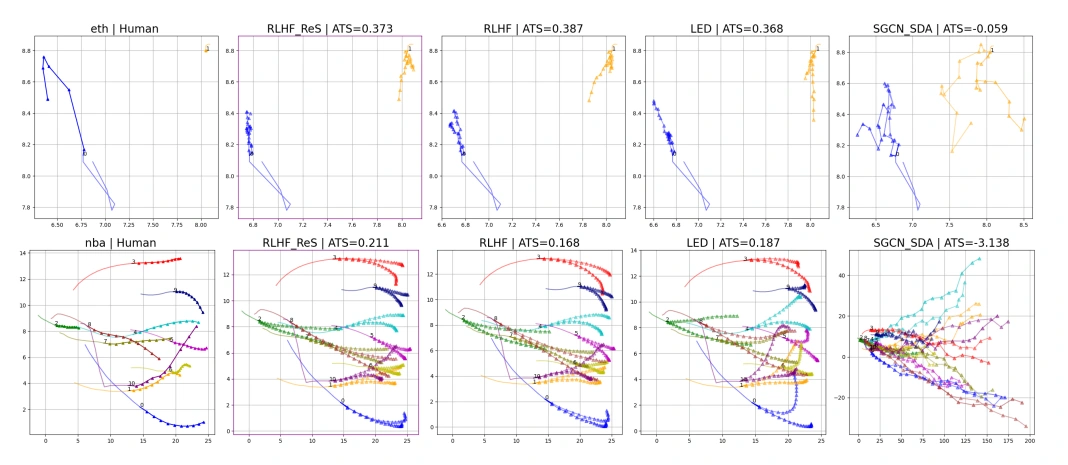
The first column shows observed trajectories in ETH and NBA; later columns show predictions from RLHF-ReS, RLHF, LED, and SGCN-SDA. The displayed candidates are ranked by the proposed trajectory score, with the top two predictions shown for each person.
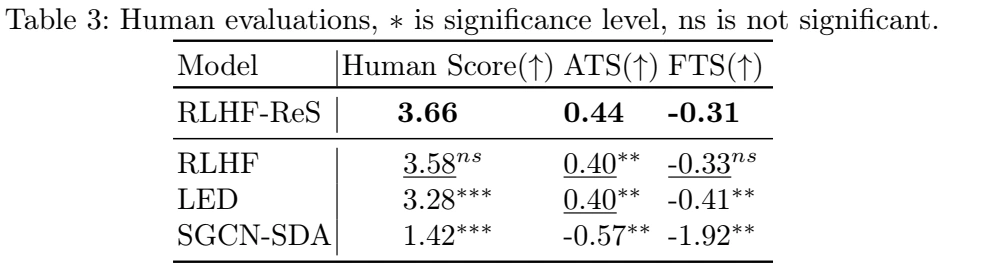
Human evaluation uses 12 scenes, 20 judges, and a five-point Likert scale for social appropriateness and motion behavior. RLHF-ReS has a mean rating of 3.66, compared with 3.58 for RLHF, 3.28 for LED, and 1.42 for SGCN-SDA. The RLHF versus RLHF-ReS human-score difference is marked not significant in the table; the significance markings are retained for the other comparisons.
Reward choice, candidate ranking, and adaptation
The text-only ablations compare learned preference rewards with a hand-crafted social-distance reward. RLHF-SDA gives 0.32 ADE / 0.53 FDE, versus 0.30 / 0.44 for RLHF-ReS.
For candidate selection, the highest-ATS trajectory matches the minimum-ADE candidate 21.9% of the time. Looking at the top five raises recall to 67.4%. For FTS, Top-1 and Top-5 recall are 18.4% and 57.4%. These results test whether the learned scores can identify accurate candidates without selecting them using future ground truth.
The paper also adapts the model using a longer context: five consecutive segments spanning 16 seconds, followed by prediction of the next 12 frames. In this experiment, ADE changes from 0.30 to 0.28, and FDE from 0.44 to 0.40. These are separate adaptation results, not the settings represented by every row of the main tables.